Leveraging Business Data For Informed Decision Making
Managing data can become overwhelming as different systems are introduced into an organisation's digital ecosystem - Ensuring proper data maintenance is essential to avoid complications and facilitate effective business intelligence management.
Designpluz have been working with business critical data for years in order to provide many different services, including BI Reporting & Data Analytics.
There’s two key considerations when working with business data: gathering, consolidating, managing, storing and protecting business data in the cloud as well as interpreting said data in order to draw conclusions which shape the speed and direction of business growth.
Designpluz have experts adept at both of these key considerations, working with business executives to understand their own data and draw powerful insights from it.
- Inadequate visibility into key performance indicators (KPIs).
- Absence of centralised data storage.
- Lack of cloud-based data management with adequate backups and security.
- Disparate systems managing data in different ways.
- Issues with data duplication, inconsistencies and loss.
- Absence of data-driven decision-making frameworks.
- Lack of data visualisation dashboards from the executive level down.

Make informed business decisions and leverage your data for accelerated business growth.
Get StartedHow BI Reporting & Data Analytics Can Transform Your Business?
With the advancement of cloud data hosting and management, businesses are empowered with invaluable data management services and processes, driving informed business decisions. Tools like PowerBI & Tableau have revolutionised how businesses and executives view and manage their operations and role based privileges mean other key personnel can also view data specific to their own performance, such as salespeople.
Your BI & Data Analytics Team
- Business Analysts
- Software Consultants
- Cloud Architects
- Database Engineers
- PowerBI Developers
- Backend & Frontend Software Developers
- Project Managers
- Software Testers & Quality Analysts
Service Level Agreements, Cloud Hosting & Software Maintenance

At Designpluz, we focus on developing scalable, reliable software that supports our clients’ businesses for the long term, fostering trust-based relationships. Our service level agreements (SLAs) for developed software provide peace of mind, allowing you to focus on business growth while we ensure the ongoing integrity of your systems. Our approach to software development is centred around cloud infrastructure, leveraging powerful frameworks to maximise market offerings. Our expertise in cloud FinOps ensures operational costs remain low without sacrificing functionality. We host our software on Amazon Web Services (AWS) or Microsoft Azure, taking full responsibility for software uptime and support. Through our AGILE development methodology, we provide continuous feature enhancements, ensuring ongoing improvement and regular product releases. Client involvement is integral to our process, with thorough testing conducted by our team and key stakeholders prior to launch.
By connecting your business software through an independent cloud middleware EDI hub, we facilitate seamless data exchange and master data management for use on BI visualisation and data analytics exercises.

Our Approach
We approach data analytics and BI reporting from a meticulous and well planned outlook which ensures we manage data merging and management correctly, so that there’s no data loss or inconsistencies.
Reporting and analytics requirements are different from business to business and in-depth consultation is vital to ensure reports are valuable to a business, providing insights which guide business decisions.
Discover
We collaborate with all stakeholders to discuss existing systems and identify challenges in data management including data duplication, loss, inaccuracies and more. We consider a solution which will enable data management across these business systems and how it will impact day-to-day operations.
Workshopping, Backlog & Commencement
We initiate the project with a collaborative workshop, engaging with you in detailed discussions about the project. This includes a comprehensive overview of our processes and a clear outline of what to expect throughout the project duration. We prioritise keeping all stakeholders informed. After thoroughly understanding the project and current systems, we develop a task backlog. This backlog underpins our AGILE development methodologies, ensuring smooth project execution and staged production releases to begin delivering value as soon as possible.
Connection Methods, Data Mapping & Data Manipulation
As the project begins, we connect each system in a testing environment to develop without disrupting production systems. We address data mapping requirements between systems and manipulate data to ensure seamless communication. We collaborate with clients to verify functionality in testing environments and plan the launch date.
Craft Interactive Reports Tailored to Your Business
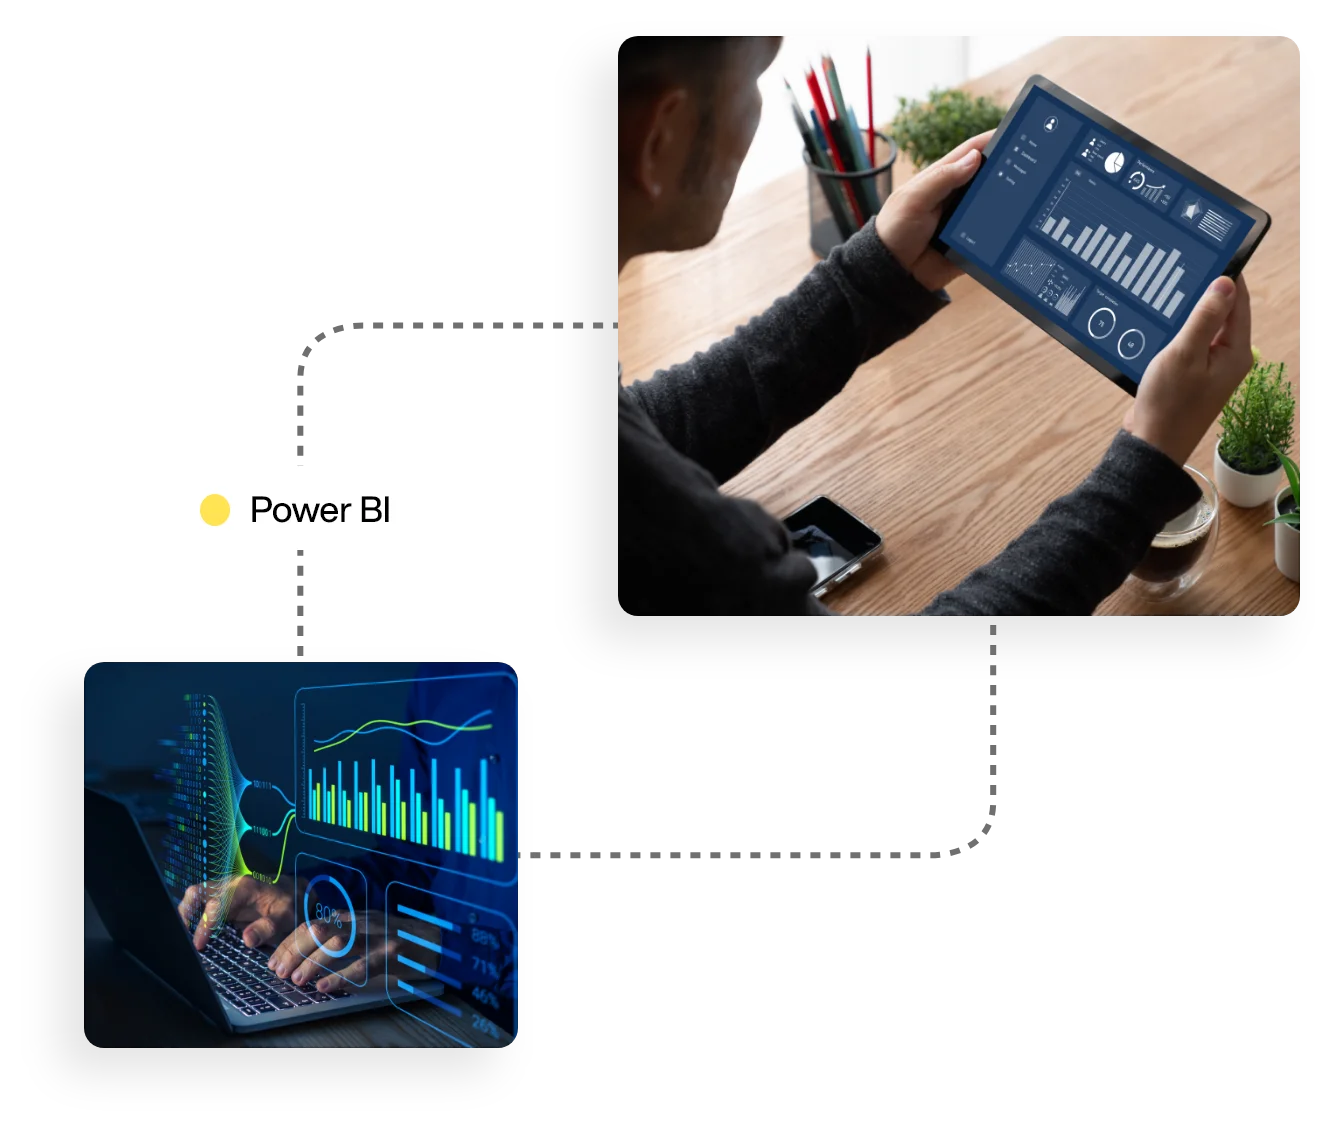
Generate impressive reports featuring interactive data visualisations. Narrate your company’s data story with a user-friendly drag-and-drop canvas and a vast array of modern data visuals from Microsoft and partners. Alternatively, create your own visuals using the Power BI open-source custom visuals framework.
Enhance your reports with theming, formatting, and layout tools. Utilise features like quick measures, grouping, forecasting, and clustering. Empower advanced users with full control over their models using the powerful DAX formula language.
Visual Analytics For Everyone, Anywhere
Deliver visual analytics to those who need it, on any device. Create mobile-friendly reports for viewers to access on the go. Publish from Power BI Desktop to the cloud or on-premises. Embed reports created in Power BI Desktop into existing apps or websites.